

Attach Screenshots, Recordings, and Logs
Show what went wrong without leaving the page you’re testing. Everything you capture is attached to the result of the test that’s open in the panel.
Before you start
Open a test in a run and expand Attachments. If the buttons are greyed out, the reason is shown right below them: the test has no result yet, the run is finished, or the panel is in basic mode.
Take a Screenshot
Section titled “Take a Screenshot”- Click Attach screenshot. The panel captures the tab and opens the annotation editor on top of the page.
- Mark up the picture with the tools below.
- Click Save or press
Cmd/Ctrl+Enter. The screenshot is attached to the result.
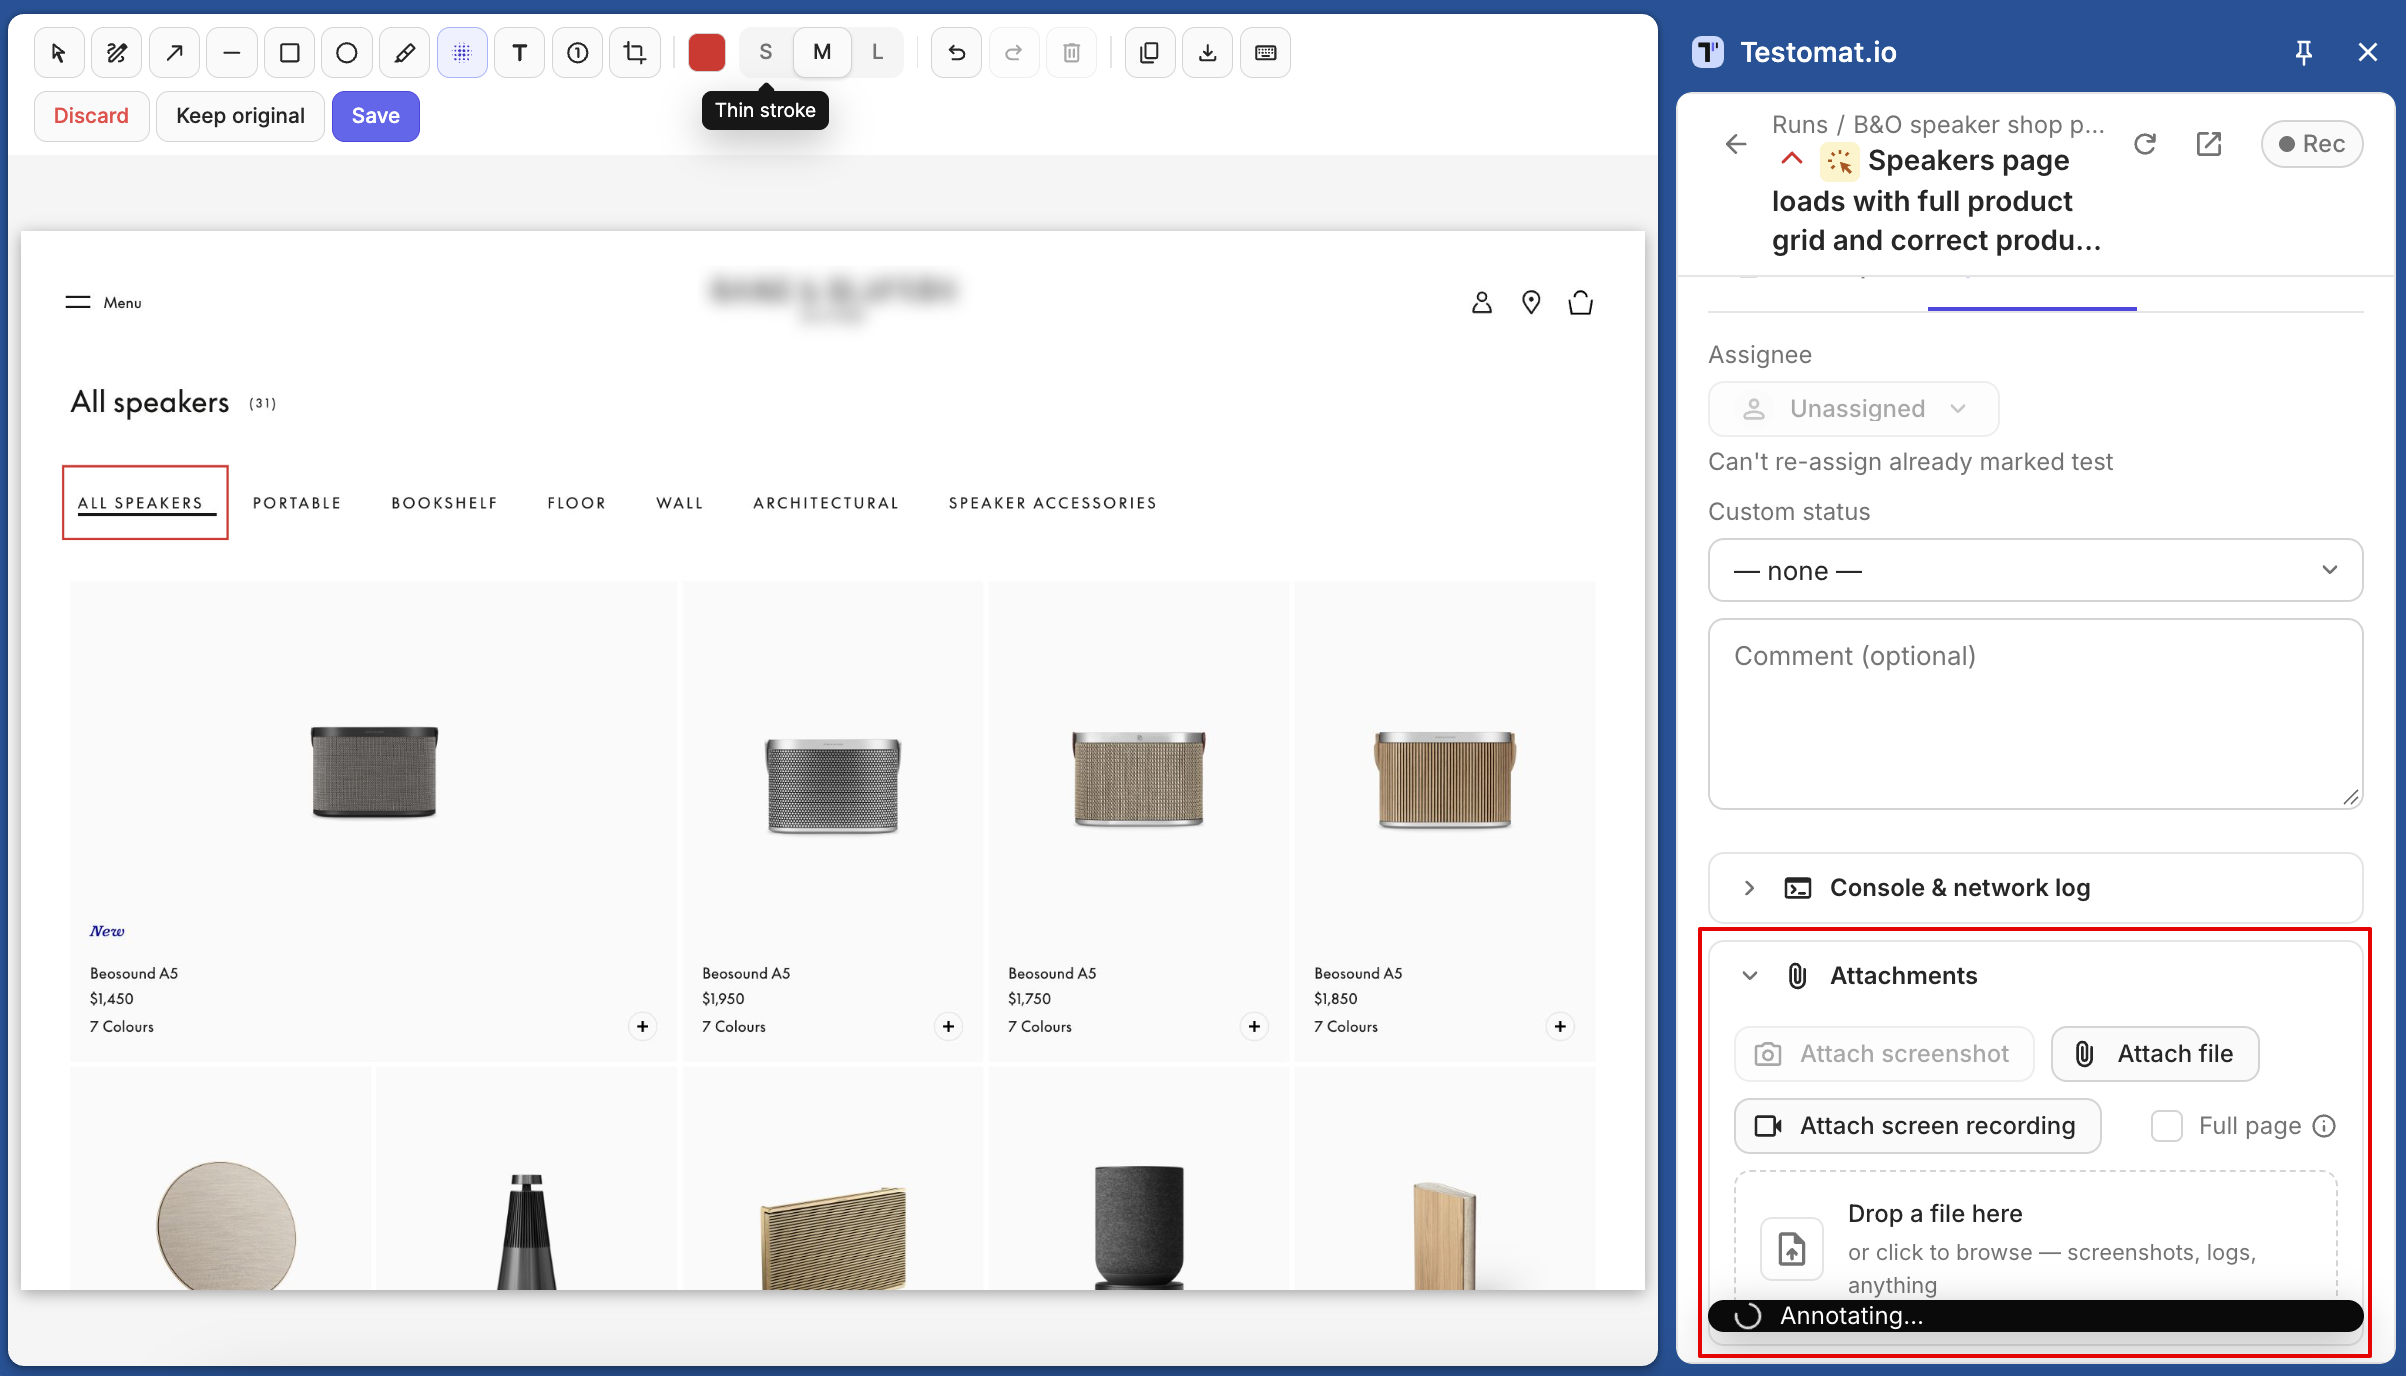
Click Keep original to attach the screenshot without annotations, or Discard (Esc) to attach nothing. If you’ve already added annotations, the panel asks you to confirm.
| Tool | Key | What It Does |
|---|---|---|
| Select | V |
Move an annotation, double-click a label to edit it, Delete removes it |
| Pen | P |
Draw freehand |
| Arrow | A |
Point at something |
| Line | L |
Draw a straight line |
| Box | R |
Frame an area |
| Ellipse | O |
Circle an area |
| Highlight | H |
Mark with translucent ink |
| Blur | B |
Hide sensitive data |
| Text | T |
Click, type, press Enter |
| Number | N |
Add numbered markers 1, 2, 3; S / M / L set the size |
| Crop | C |
Keep only the selected area |
You can edit any annotation until you click Save.
Capture the Full Page
Section titled “Capture the Full Page”Turn on Full page in Attachments before you click Attach screenshot. The screenshot then covers the whole page, including the part below the scroll.
Full-page screenshots use Chrome’s debugger, so Chrome shows a “…is debugging this browser” bar during the capture. That’s expected — the bar closes by itself. On pages that block the debugger, such as chrome:// pages, the panel takes a screenshot of the visible area and lets you know.
Record Your Screen
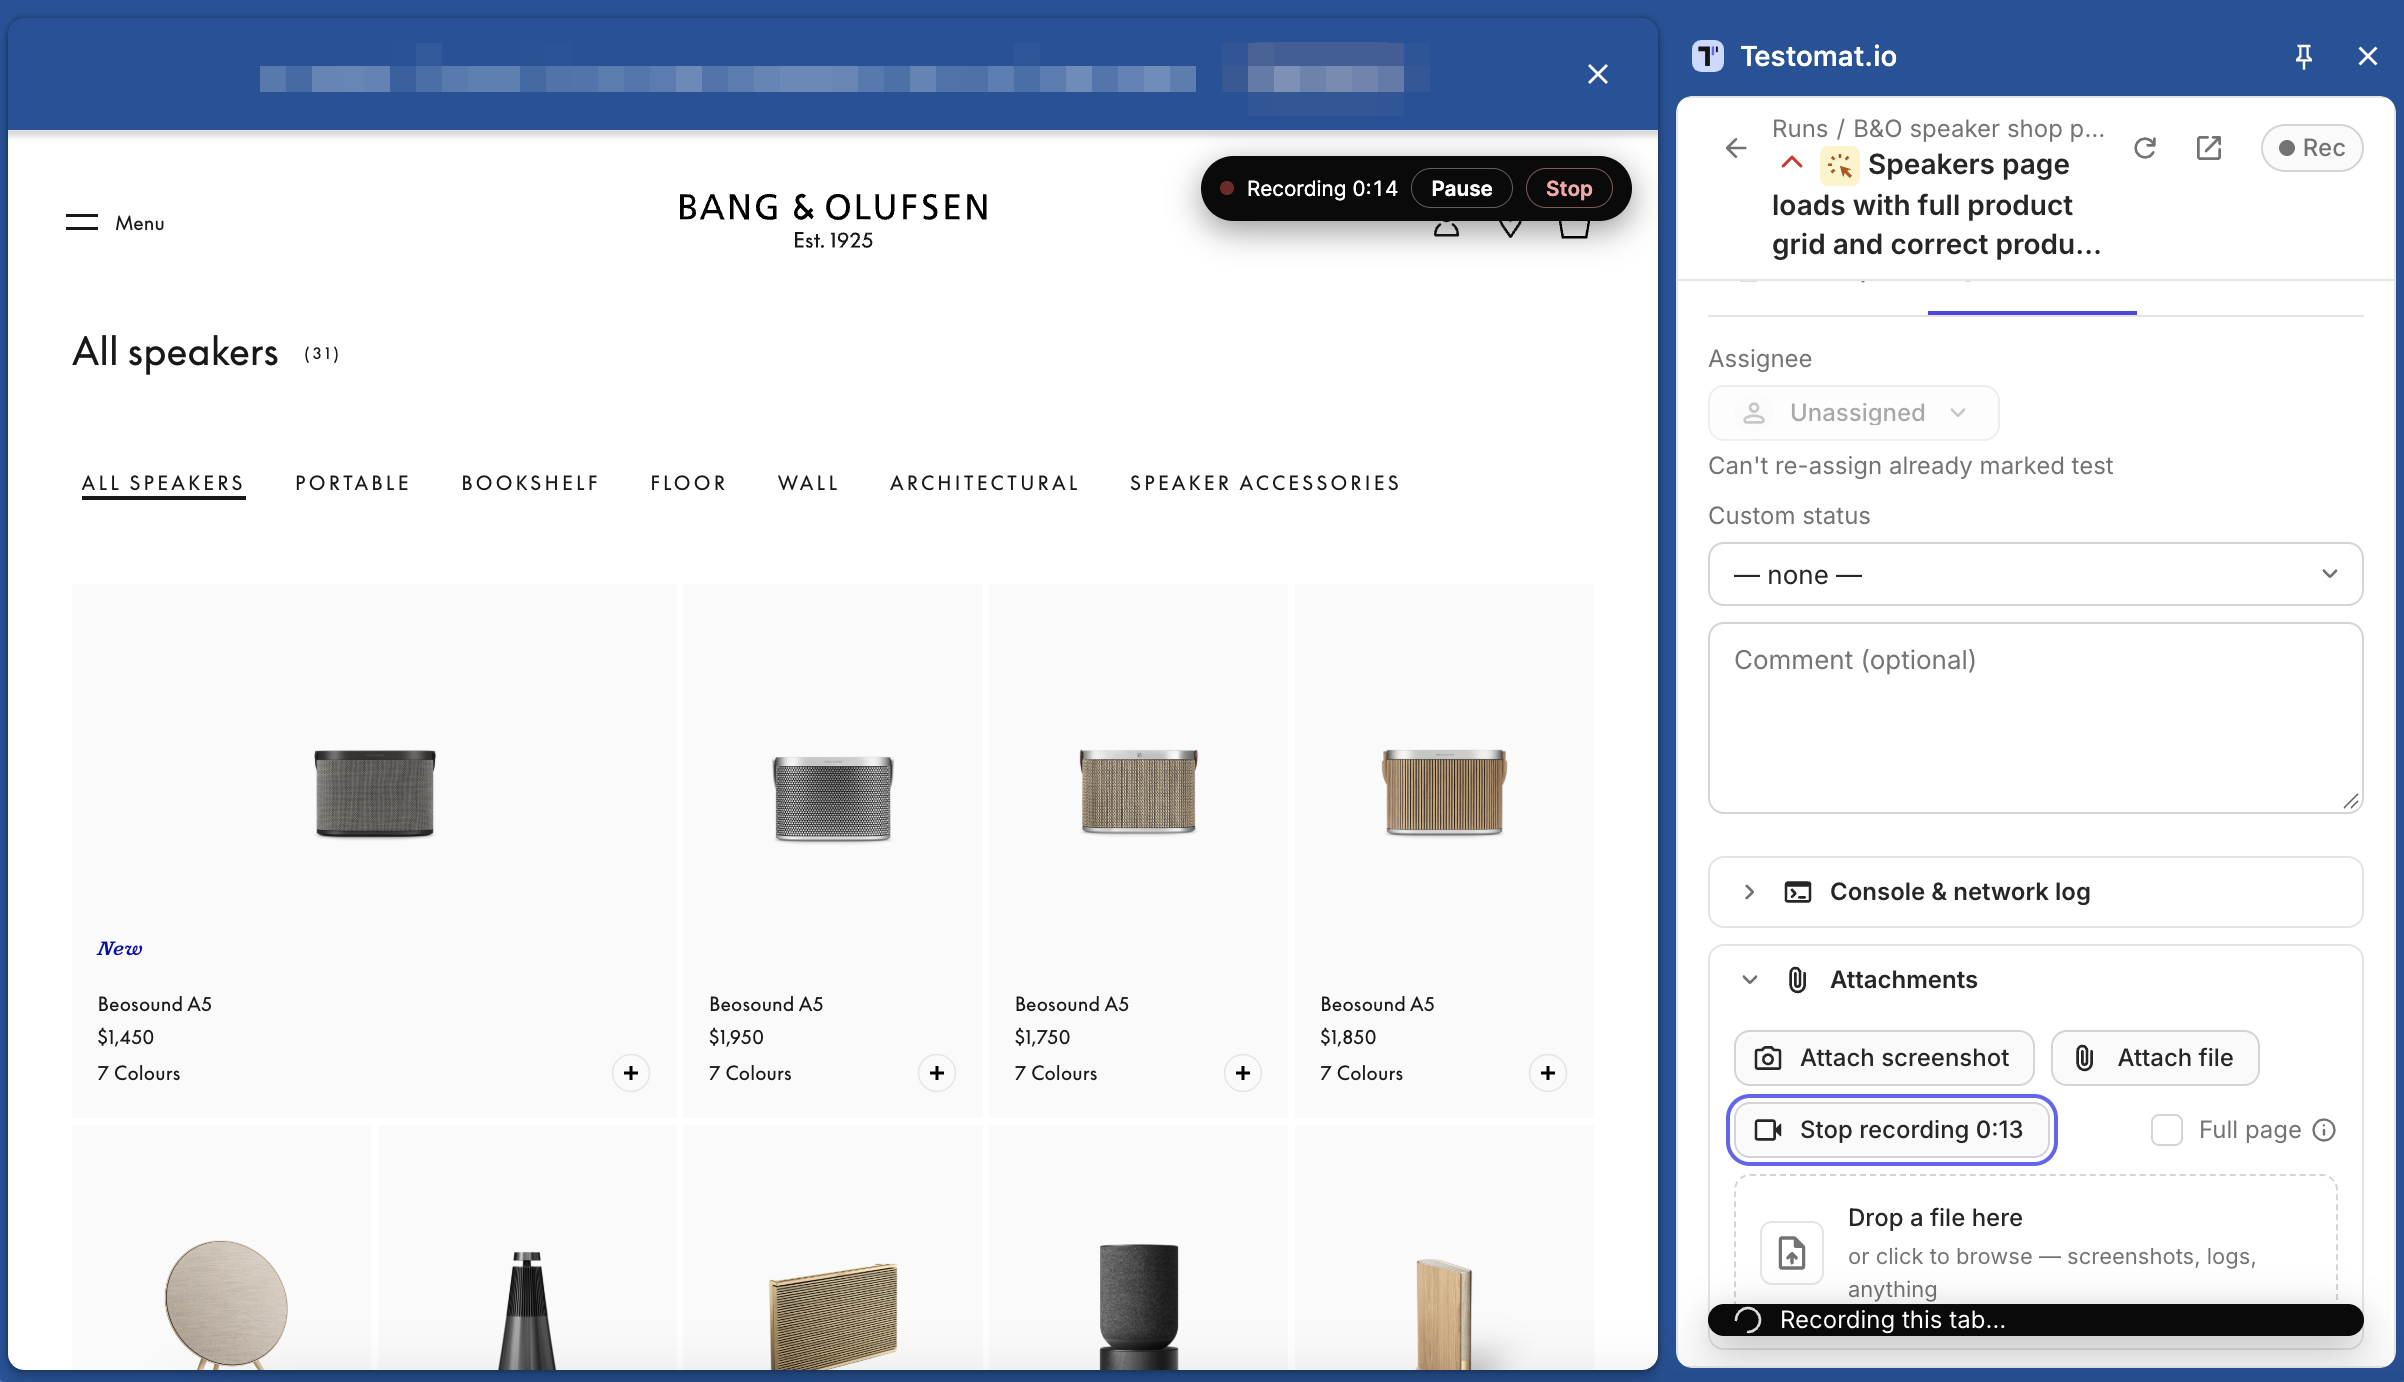
Section titled “Record Your Screen”You can start recording in three ways:
- click Attach screen recording in Attachments;
- press
Alt+Shift+Ron the page; - right-click the page and choose Testomat.io → start recording.
While recording, the controls stay on the page: a timer, Pause / Resume, and Stop. Recordings are without sound. A recording stops on its own after 5 minutes or 50 MB.
Review and Trim the Recording
Section titled “Review and Trim the Recording”When you click Stop, a review window opens over the page with a player and a timeline.
- Click Play to watch the recording.
- To cut a part out, drag over it on the timeline. To undo a cut, click ✕ on its chip under the timeline.
- Click Attach to the result. Only the parts you kept are uploaded.
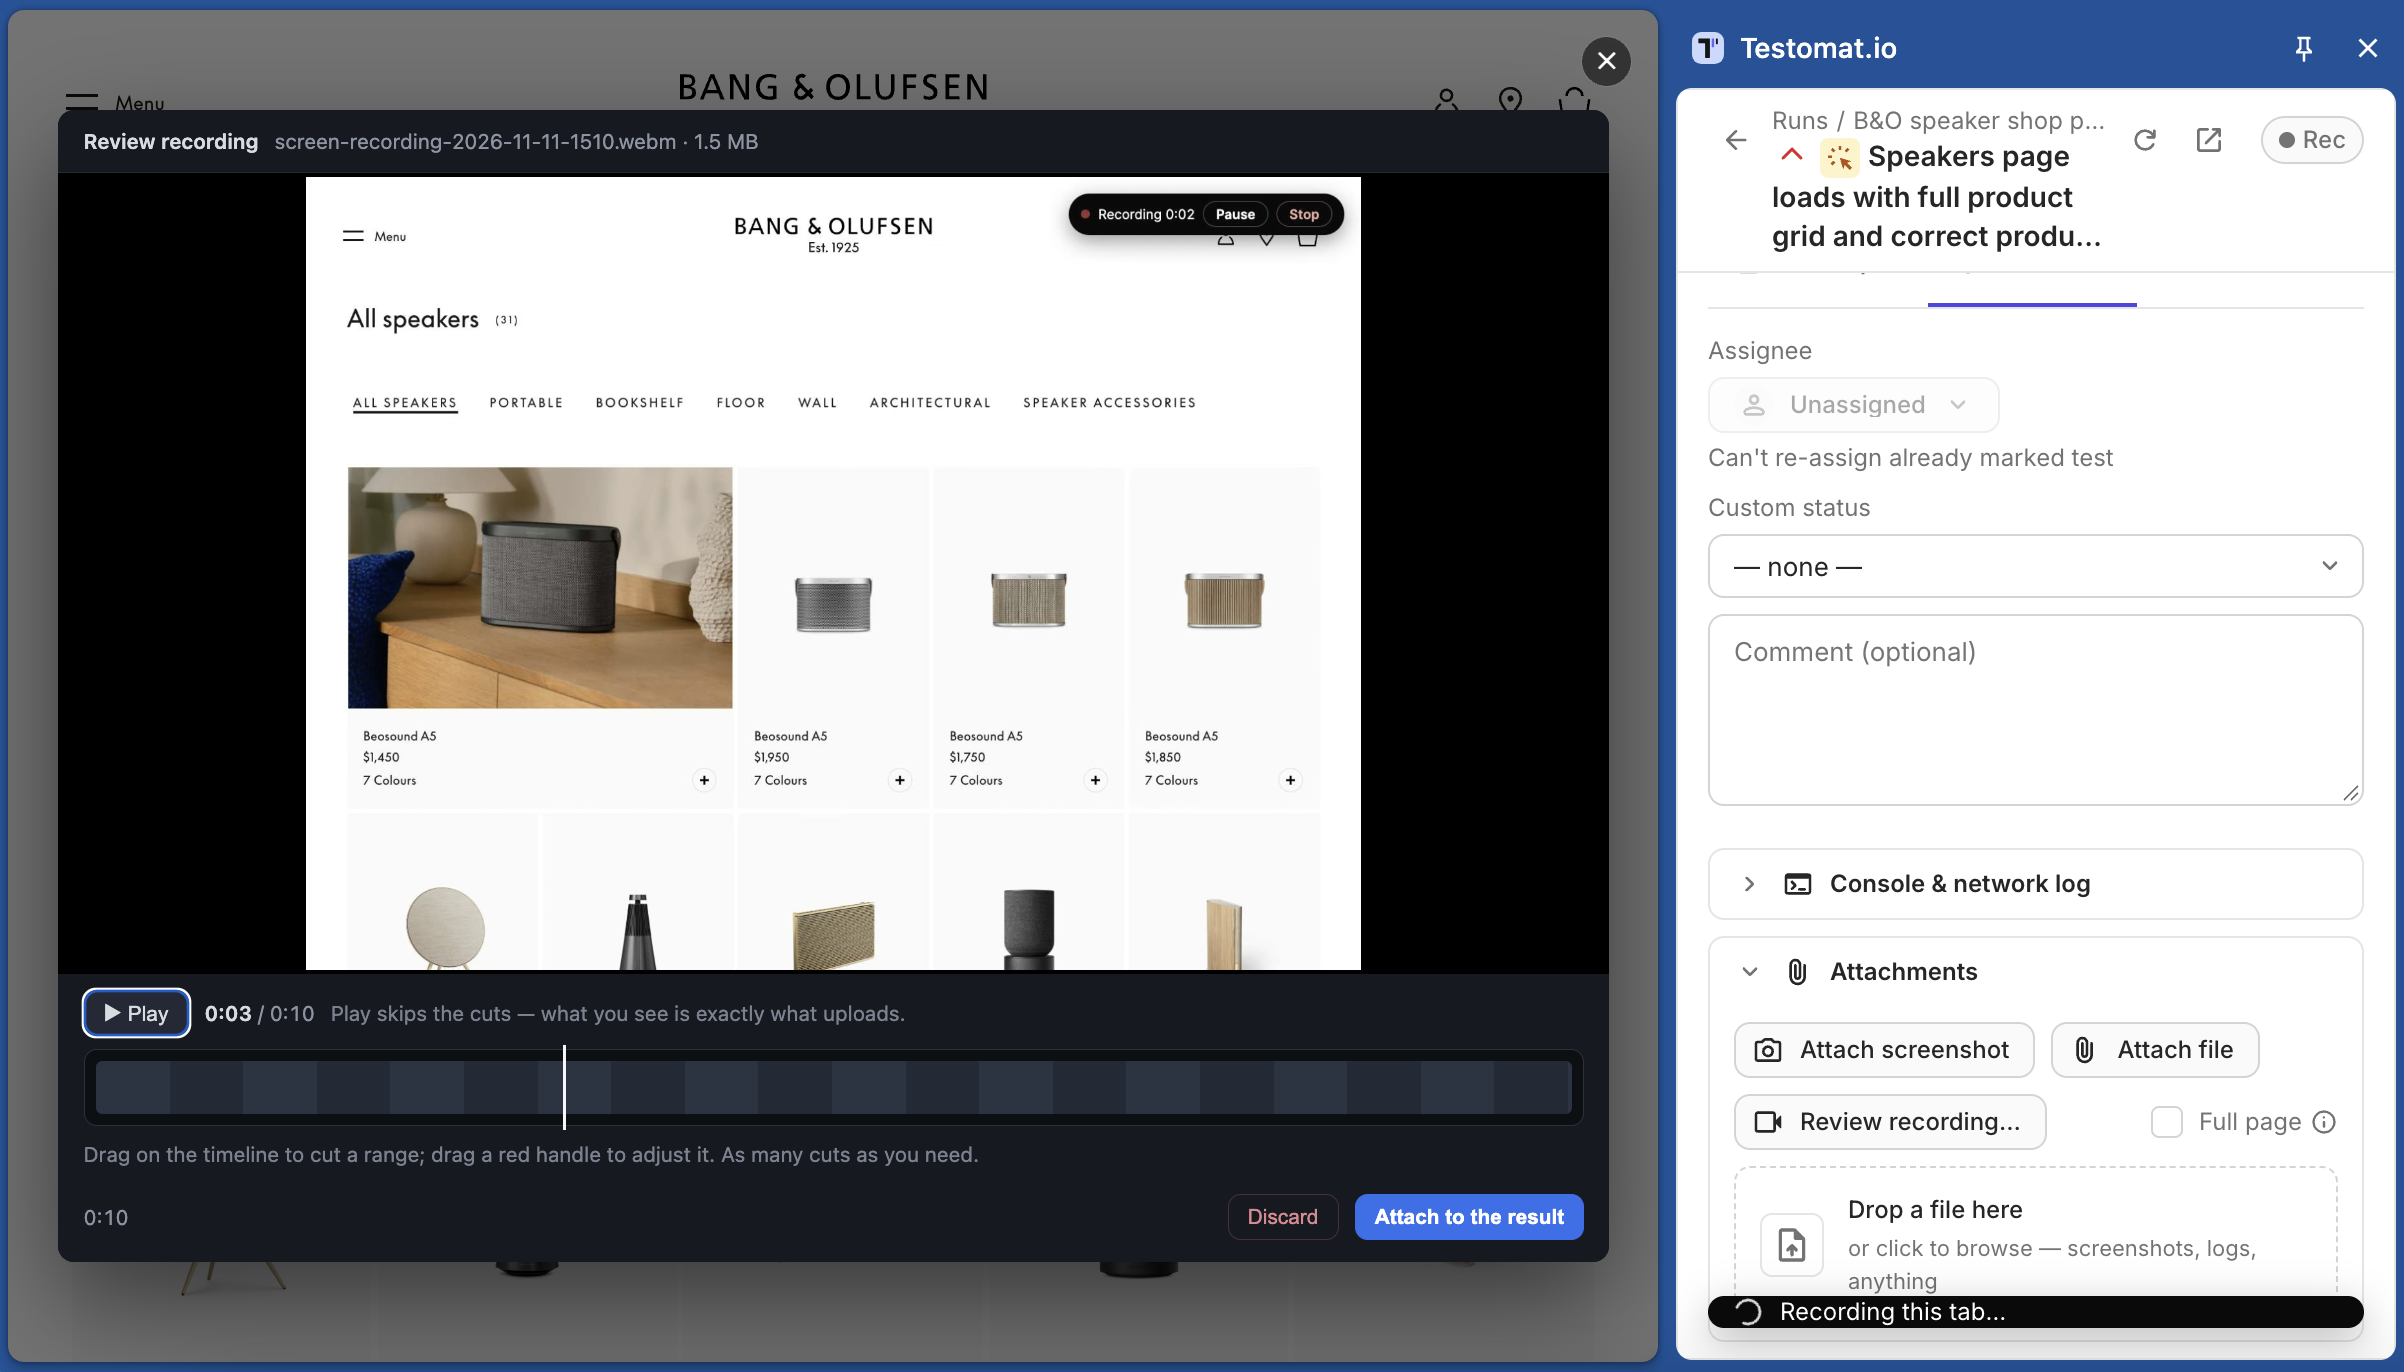
Nothing uploads until you decide. If you close the review, the recording waits in the panel, and the button reads Review recording…. To delete the recording, click Discard.
Collect Console and Network Logs
Section titled “Collect Console and Network Logs”The panel can record console errors, warnings, and network requests from the tested tab. It keeps the last 60 seconds, so turn recording on before you reproduce the bug.
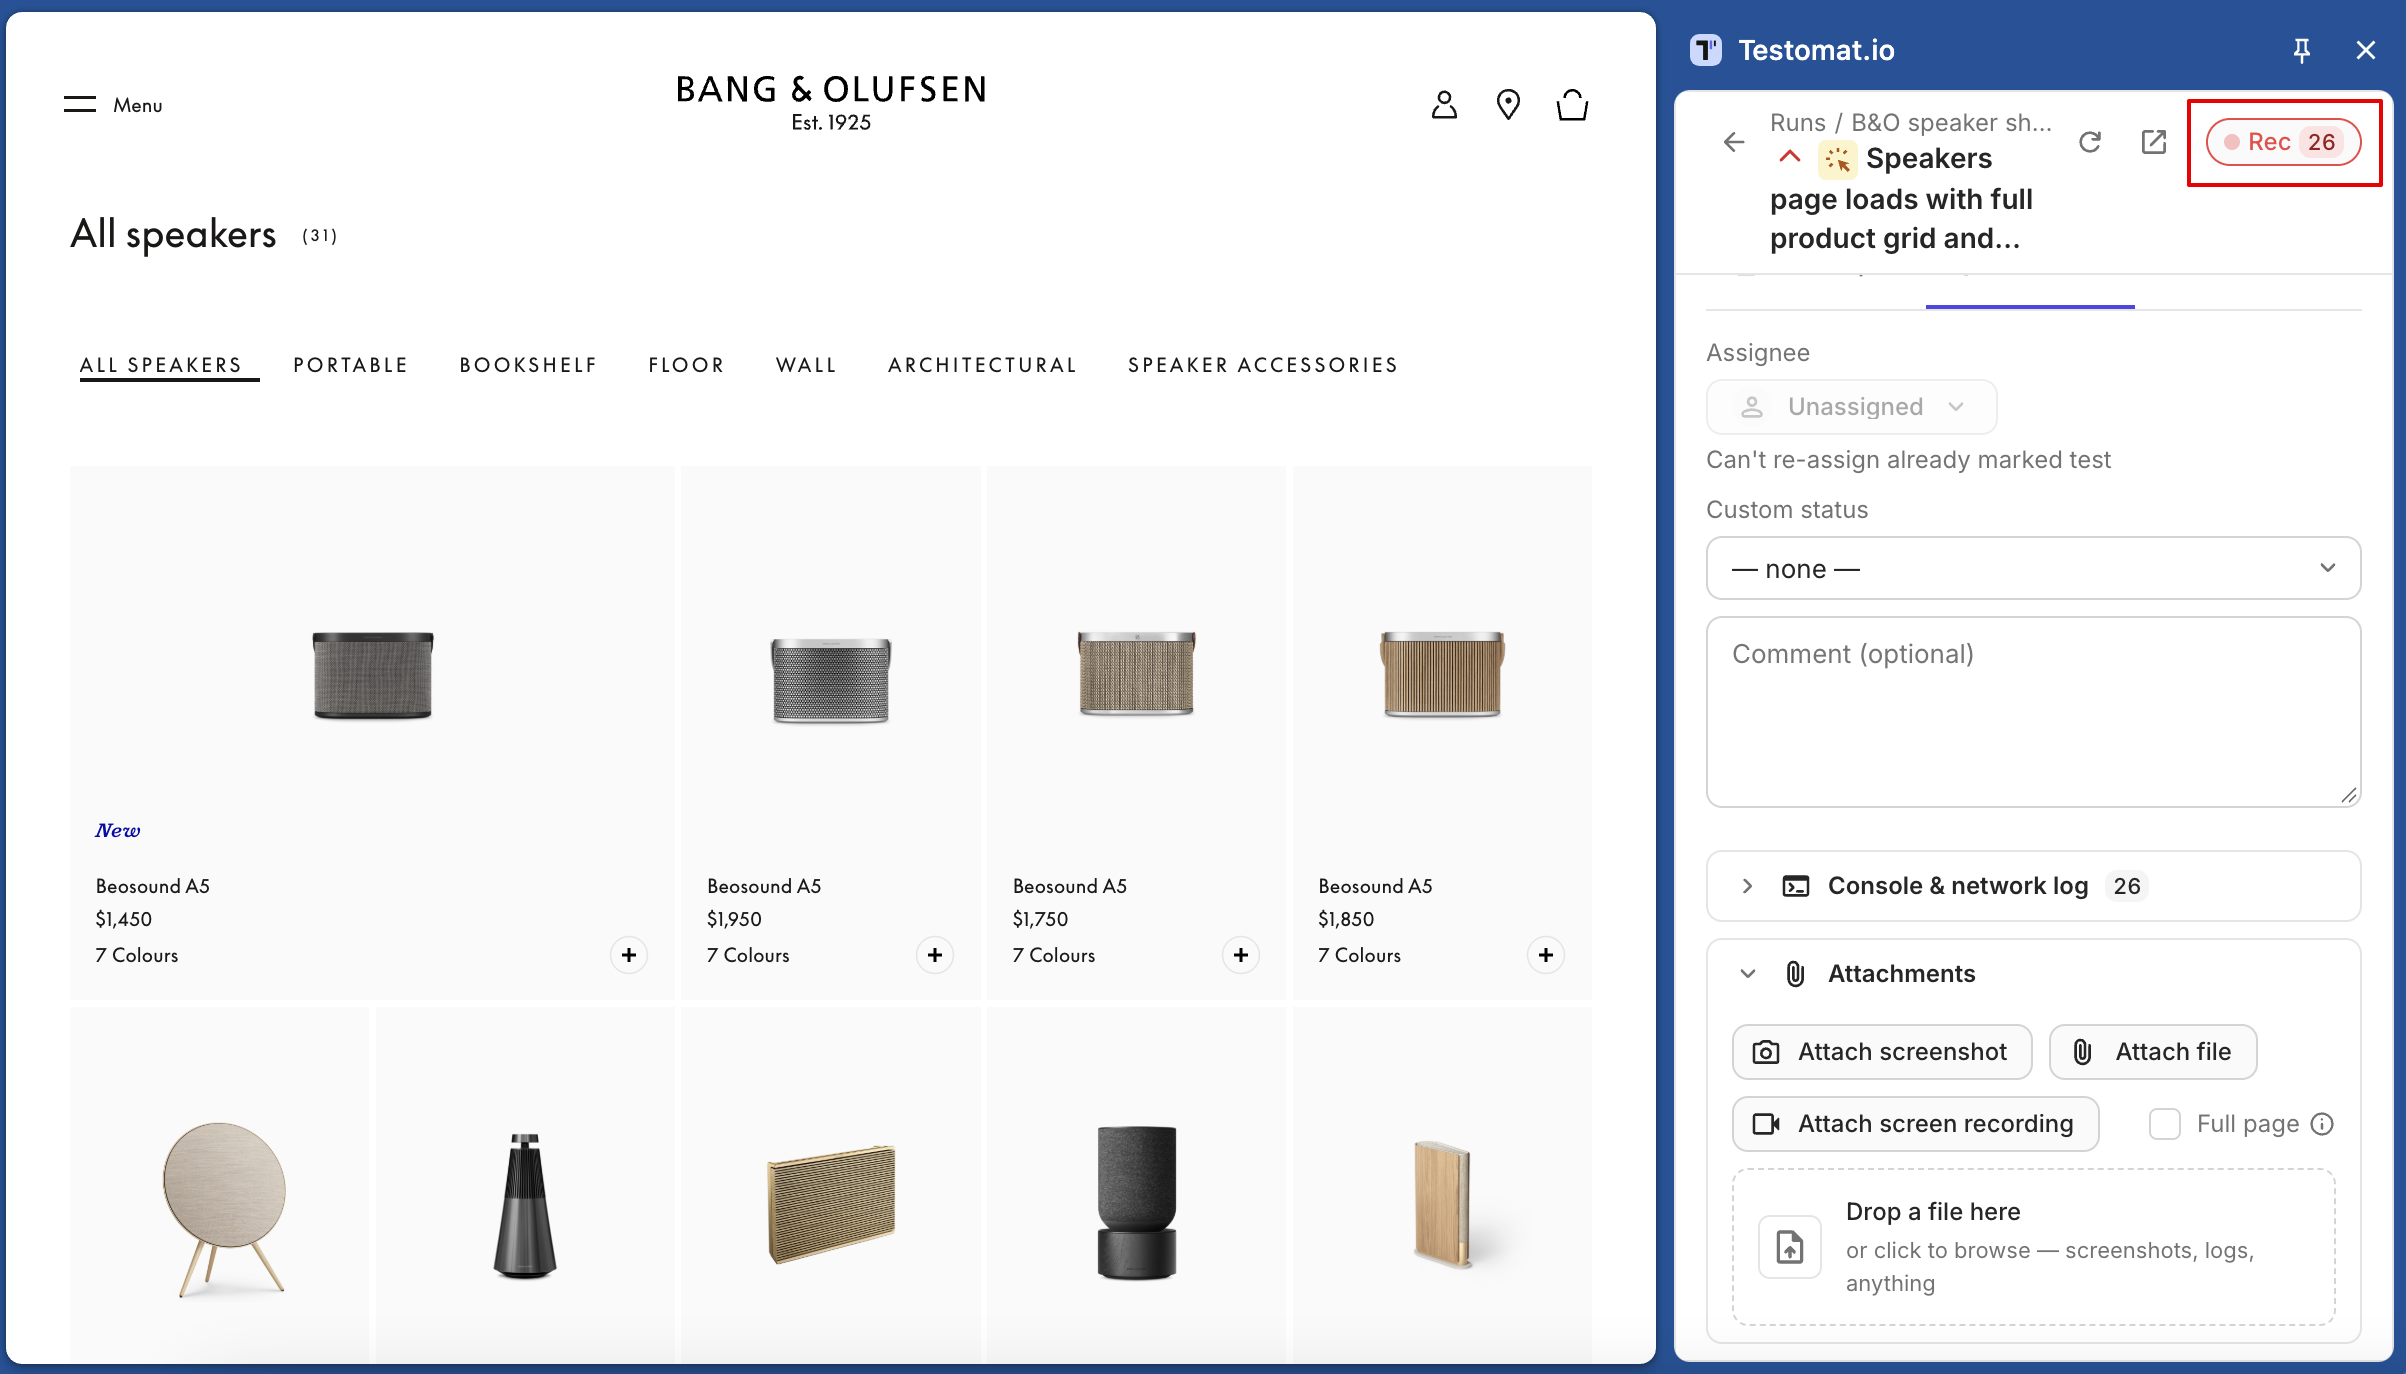
- Open the test and click Rec in the panel header.
- Reproduce the problem on the page. The Rec button counts errors as they happen. To see them, open Console & network log in the test. Each failed request shows its method, URL, and status.
- Mark the test Failed. The log is attached to the result as a
.txtfile with Console and Network sections.
For failed requests, the log also saves the first 16 KB of the response body. URLs are saved without query parameters by default, so tokens in links stay out of the file. To change any of this, or the 60-second window, go to Settings → Failure Log.